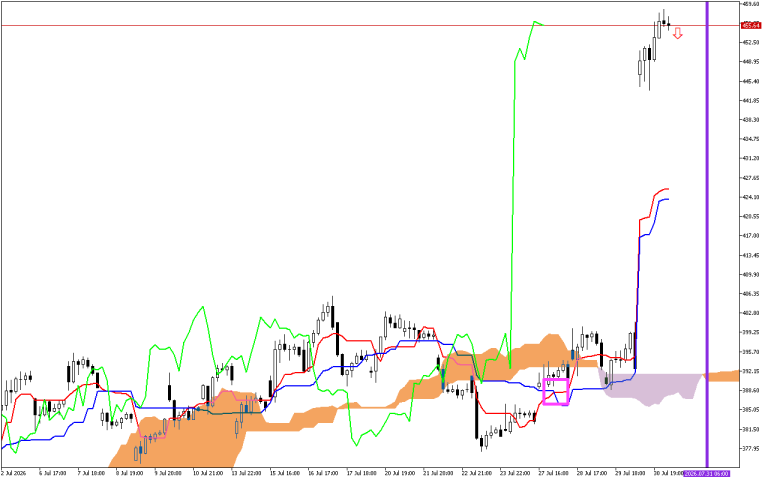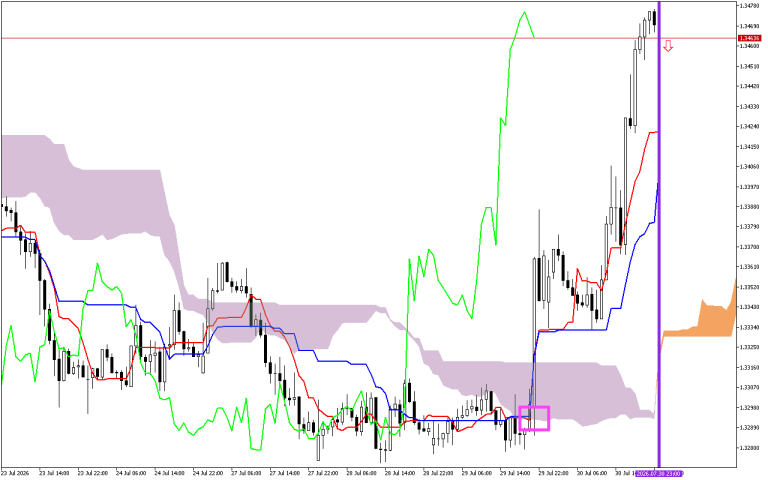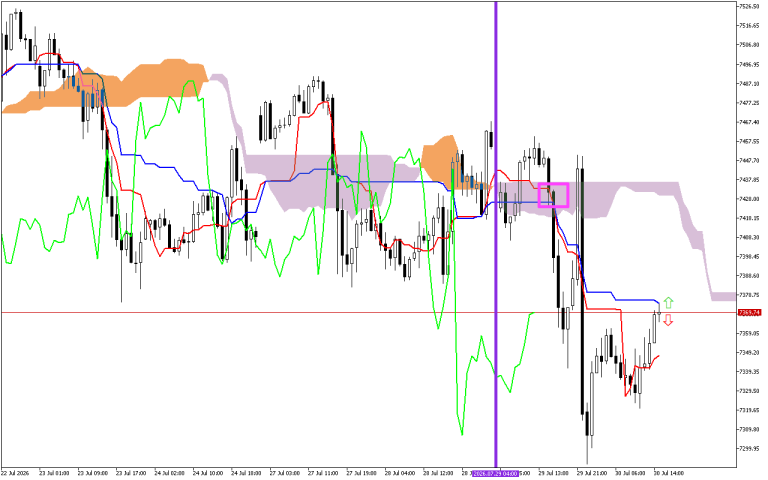
Analysis of the market situation, developed in previous trading sessions, shows the intersection of the Tenkan and Kijun lines. Typically, this signal indicates an upcoming increase, but subsequently the price fell below the Tenkan line.
The second most important signal is the change in direction of the Kumo cloud, marked with a vertical purple line. A change in the color of the cloud to lilac indicates a transition of the priority direction of movement to downward.
The current situation
Let’s look at the main components of the indicator and their current values:
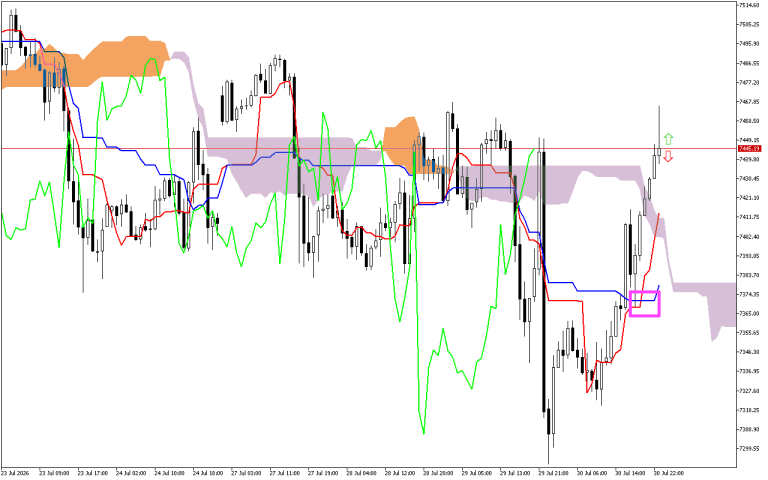
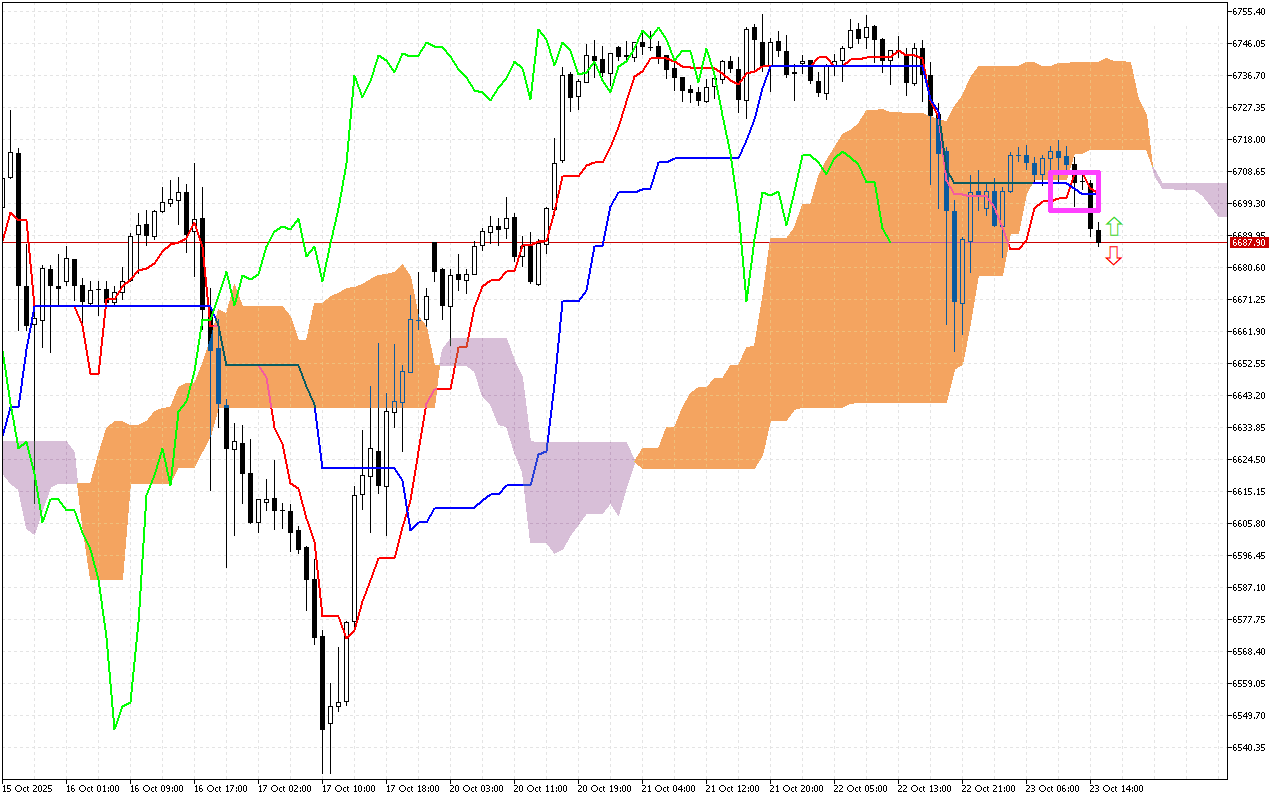
The Tenkan line remains above the Kijun line, but the price has fallen below these lines and is now holding below them.
The Kumo cloud is colored lilac. It indicates the priority of the downward vector of price movement.
The price is below the Kumo cloud, which is now acting as a resistance area for the price.
Used by investors to identify a change in trend, the green Chikou line is above the price on the chart.
Trading recommendations:
The dynamic support level is on the Kijun line, around the 6702.04 mark.
Dynamic resistance levels are on the Tenkan line, around the 6703.72, the SenkouA line, at the 6740.63, and the SenkouB line, near the 6715.01.