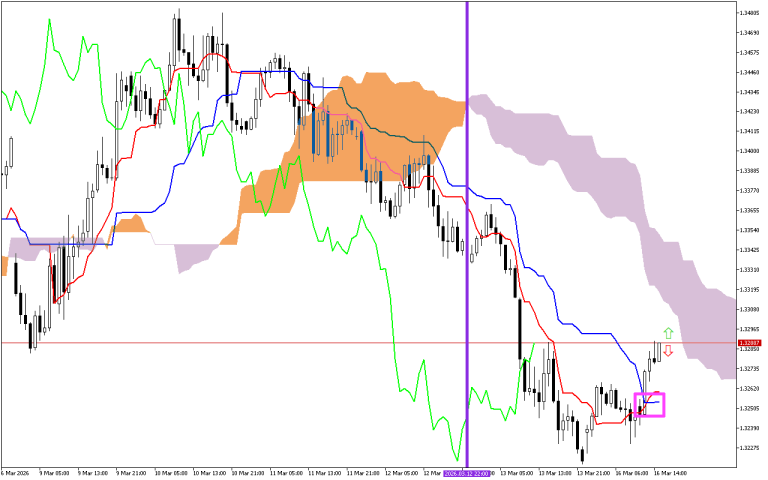
Analyzing previous trading sessions, it is worth paying attention to the intersection of the Tenkan and Kijun lines, marked with a pink square. The fast Tenkan line fell below the Kijun line, which usually signals a change in trend to a downward one. However, later the price rose above the Tenkan line, which indicates the weakness of the downward impulse.
The second important signal is a change in the color of the Kumo cloud, which is marked with a vertical purple line on the graph. The appearance of a lilac color in the cloud indicates a change in the priority direction of movement to downward.
The current situation
Let’s carefully look at the current values of the main components of the Ichimoku indicator to assess the current state of the market:
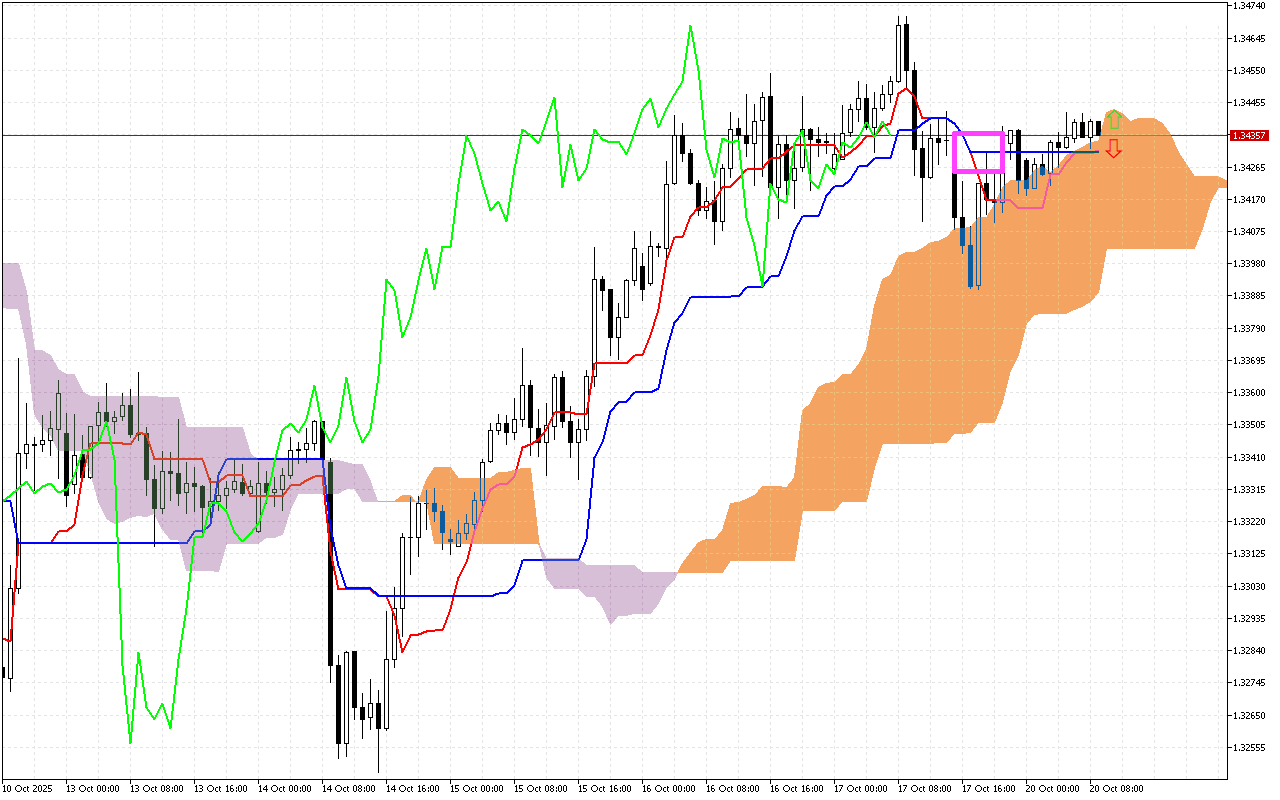
The Tenkan line remains below the Kijun line. However, the price has broken above both lines and moved higher.
Now the Kumo cloud is tinted lilac, which indicates a possible change in price dynamics in a negative direction.
Currently, the Kumo cloud lines represent a dynamic support area for price.
Used by investors to identify a change in trend, the green Chikou line is held below the price on the chart.
Trading recommendations:
Dynamic support levels are on the Tenkan line, around the 1.34304, the SenkouA line, at the 1.34337, and the SenkouB line, around the 1.33869.
The dynamic resistance level is on the Kijun line, around the 1.34307 mark.
The main Ichimoku system indicators prioritize searching for entry points into short positions, on a price rollback to the resistance levels.