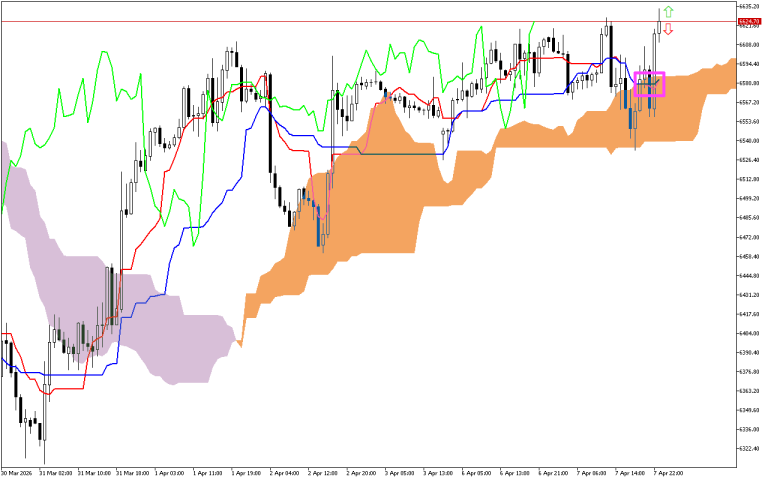

Analyzing previous trading sessions, it is worth paying attention to the intersection of the Tenkan and Kijun lines, marked with a pink square. The fast Tenkan line fell below the Kijun line, which usually signals a change in trend to a downward one. However, later the price rose above the Tenkan line, which indicates the weakness of the downward impulse.
The current situation
Let’s carefully look at the current values of the main components of the Ichimoku indicator to assess the current state of the market:
The Tenkan line remains below the Kijun line. However, the price has broken above both lines and moved higher.
The dynamics of price movement over a longer distance is determined by the Kumo cloud, which is now colored orange. Thus, this signal prioritizes the upward vector of price movement in the future.
Currently, the Kumo cloud lines represent a dynamic support area for price.
Used by investors to identify a change in trend, the green Chikou line is held below the price on the chart.
Trading recommendations:
Dynamic support levels are on the Tenkan line, around the 6576.01, the SenkouA line, at the 6585.59, and the SenkouB line, around the 6539.82.
The dynamic resistance level is on the Kijun line, around the 6580.13 mark.