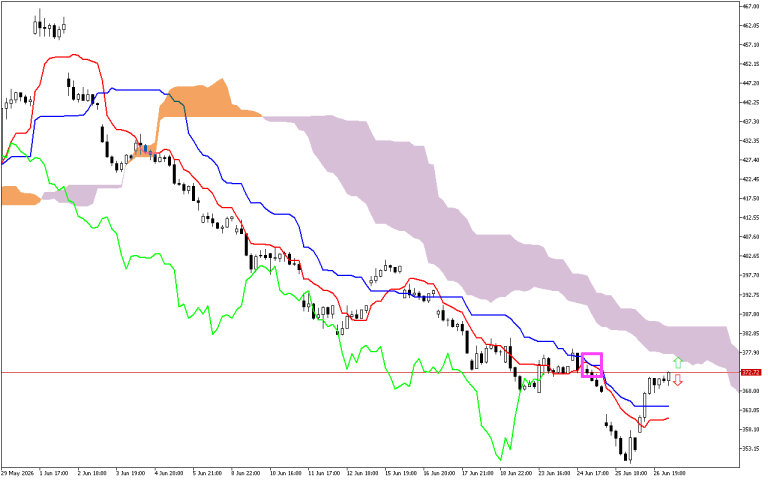

The key moment of previous trading sessions was the intersection of the Tenkan and Kijun lines. This signal is marked on the chart with a pink square and indicates a change in the trend to a downward one. However, subsequently the price was noted to have risen above the Tenkan line, indicating weakness in the downward momentum.
The current situation
Let’s look at the main components of the indicator and their current values:
The price is above the Tenkan and the Kijun lines. It may indicate an upcoming shift in market direction.
The Kumo cloud is colored lilac. It indicates the priority of the downward vector of price movement.
The price is below the Kumo cloud, which is now acting as a resistance area for the price.
Used by investors to identify a change in trend, the green Chikou line is above the price on the chart.
Trading recommendations:
The dynamic support level is on the Tenkan line, around the 360.56 mark.
Dynamic resistance levels are located on the Kijun line, near the 364.02, the SenkouA line, at the 377.59 mark, and the SenkouB line, near the 384.77 mark.
The indicator signals support a downward vector of price movement, so the search for the short positions entry points should be prioritized.